

We built the first interactive tool that lets you compare fetal measurements across every major reference standard and weight formula. Here’s why that matters.
This is an interactive fetal biometry tool for the doctors who order growth scans and the patients who lose sleep over them.
Here’s something that happens in every ultrasound room in America: a sonographer measures your baby’s head, belly, and thigh bone. Those numbers get plugged into softwaHere’s something that happens in every ultrasound room in America: a sonographer measures your baby’s head, belly, and thigh bone.
Those numbers get plugged into software. The software compares your baby’s size to thousands of other babies at the same gestational age and spits out a number: a percentile.
If your baby is in the 50th percentile, that means half of all babies that age are smaller and half are bigger. If your baby is in the 10th percentile, 90% of babies are bigger.
That single number determines whether your doctor tells you the baby is “measuring on track” or “a little small” or “on the bigger side.” It determines whether you go home reassured or spend the next four weeks unable to sleep. And most pregnant women walk out of that appointment with a printed report full of abbreviations they’ve never seen before: BPD, HC, AC, FL, EFW. Numbers in millimeters and grams that mean everything to the clinician and nothing to the patient holding the paper.
What nobody tells you is that the percentile your baby gets depends entirely on which growth chart the software uses. And there are six major ones.re. The software spits out a percentile. Your doctor tells you the baby is “measuring on track” or “a little small” or “on the bigger side.”
What nobody tells you is that the percentile your baby gets depends entirely on which growth chart the software uses. And there are at least six major ones.
A baby measuring at the 8th percentile on one chart, flagged for possible growth restriction, might land at the 14th percentile on another. Same baby. Same measurements. Different chart, different clinical decision.
What Actually Happens in Practice
Most ultrasound software comes preloaded with a default reference standard. In the United States, that default is usually Hadlock 1991, a growth curve derived from a single-center study of roughly 400 pregnancies in Houston, Texas. The original paper, it turns out, contains an internal discrepancy between its published equation and its published table that wasn’t identified until 2025, and that discrepancy may have caused 5% of patients to be misclassified.
Most clinicians never change the default. Most patients never know a default exists.
Meanwhile, the past decade has produced several large, methodologically rigorous growth standards: the INTERGROWTH-21st project (multinational, prescriptive, published 2014), the WHO Fetal Growth Charts (10 countries, 2017), the NICHD Fetal Growth Studies (U.S. race-specific, 2015, and then a unified standard in 2022), and the Salomon/CFEF French standard (2006). Each was built differently, studied different populations, and produces different curves.
The same is true for estimating fetal weight. The Hadlock group alone published four different formulas using different combinations of measurements. Shepard’s 1982 formula uses only BPD and AC. The INTERGROWTH formula uses HC and AC, no femur. Each gives a different number in grams, and that number then gets plotted on whichever growth chart the machine happens to use.
Two independent choices, both invisible to the patient, both affecting whether anyone sounds an alarm.
What This Tool Does
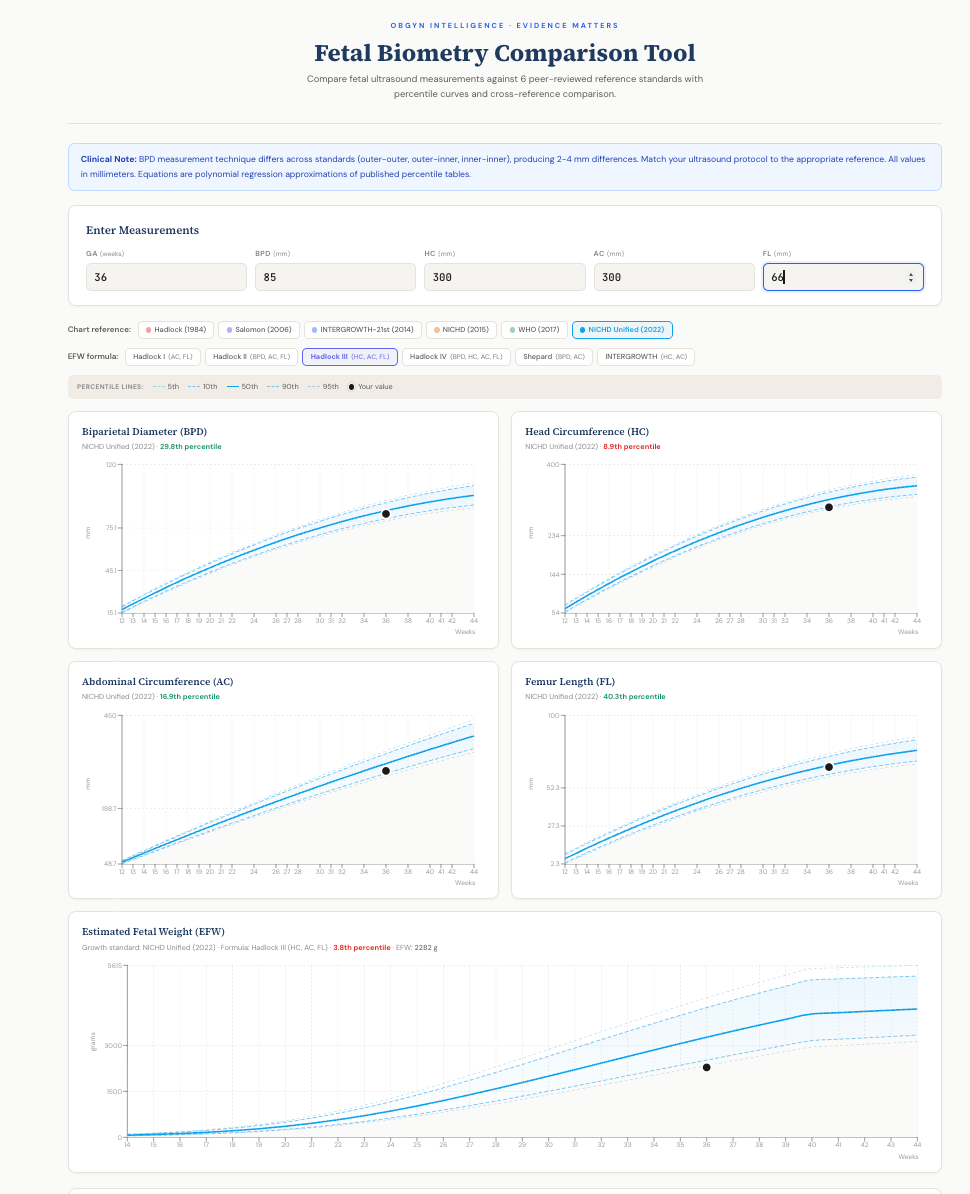
We built an interactive tool that makes both choices visible and adjustable.
Enter four measurements from any ultrasound report: biparietal diameter (BPD), head circumference (HC), abdominal circumference (AC), and femur length (FL). The tool plots each measurement against all six reference standards simultaneously, showing percentile curves from the 5th through the 95th.
Choose your EFW formula. Six options, from Hadlock’s minimal two-parameter version (AC and FL only) to the full four-parameter formula (BPD, HC, AC, FL), plus Shepard and INTERGROWTH. Switch between them and watch the estimated weight change. At term, the difference between formulas can exceed 200 grams.
Choose your growth standard. The tool then plots the computed EFW against whichever percentile chart you select. A baby that looks growth-restricted on one standard may be perfectly normal on another.
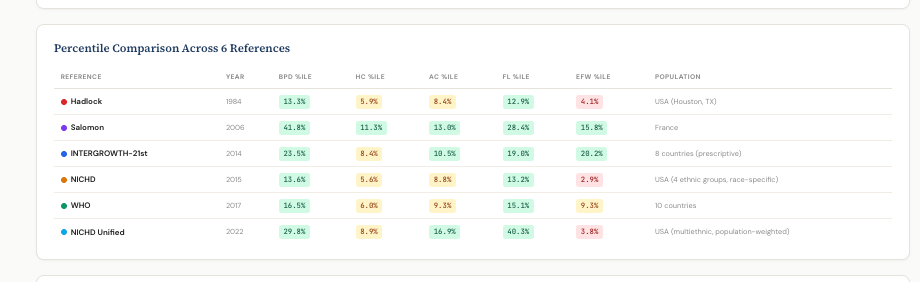
Compare across all six references at once. A comparison table shows the percentile for every measurement on every standard side by side. A second table shows the expected 50th percentile values at the entered gestational age, revealing how much the standards themselves disagree, sometimes by more than 400 grams at term.
Try it here →
No other publicly available tool does this. Existing calculators use one formula and one growth chart, the exact setup that keeps the problem invisible.
Why This Matters for Patients
If you’ve had an ultrasound that flagged your baby as small or large, you deserve to know how much of that assessment depends on which chart was used. This isn’t about second-guessing your doctor. It’s about having the same information your doctor has, or should have.
The tool doesn’t diagnose anything. A single ultrasound measurement is a snapshot, not a trajectory. Growth assessment requires serial measurements over time, and clinical context matters enormously. But when your chart says “7th percentile” and your anxiety spikes, it helps to know that the same measurements might read “12th percentile” on a different, equally validated standard.
Know your numbers. All of them.
Why This Matters for Clinicians
If you’re an obstetrician or sonographer, you already know that growth chart selection matters. But when was the last time you checked which standard your software uses? When was the last time you compared it against the alternatives?
The NICHD Unified Standard (2022) was specifically designed to replace race-stratified growth charts with a single, population-weighted U.S. curve. It runs systematically heavier than the older Hadlock standard, particularly at term, with a 50th percentile exceeding 4,000 grams at 40 weeks versus Hadlock’s 3,619. That’s a difference that changes how many patients get flagged, how many get induced, and how many get labeled with a diagnosis of fetal growth restriction.
This tool lets you see those differences instantly, for any gestational age, for any combination of measurements. Use it for teaching, for clinical calibration, or for having an honest conversation with a patient about what “measuring small” actually means.
The Six Reference Standards
The tool includes every major fetal growth standard published in the past 40 years:
Hadlock (1984) published in Radiology from a Houston, Texas cohort of approximately 400 pregnancies. The most widely used biometry reference worldwide. Cross-sectional design.
Salomon/CFEF (2006) published in Ultrasound in Obstetrics and Gynecology, from a French multicenter cohort. Uses inner-inner BPD measurement technique, which produces values 2-4 mm smaller than outer-outer methods.
INTERGROWTH-21st (2014) published in The Lancet, multinational prescriptive standard from 8 countries. Enrolled only low-risk pregnancies meeting strict health and nutritional criteria. Designed as a universal standard, analogous to WHO child growth charts.
NICHD Fetal Growth Studies (2015) published in American Journal of Obstetrics and Gynecology, U.S. cohort of 2,334 low-risk women with race/ethnicity-specific curves. Longitudinal design.
WHO Fetal Growth Charts (2017) published in PLoS Medicine, from 10 countries. Reference (not prescriptive) design, meaning pregnancy complications were not excluded.
NICHD Unified Standard (2022) published in American Journal of Obstetrics and Gynecology, derived from the same NICHD cohort but providing a single, population-weighted curve without race stratification. Represents the field’s move toward universal standards.
The Six EFW Formulas
Hadlock I (1985): AC + FL. Minimal inputs, surprisingly robust.
Hadlock II (1985): BPD + AC + FL. Adds head measurement.
Hadlock III (1985): HC + AC + FL. The most widely validated and commonly used formula worldwide. Recommended by multiple systematic reviews as having the lowest estimation error.
Hadlock IV (1985): BPD + HC + AC + FL. All four parameters. Not necessarily more accurate than Hadlock III despite using more inputs.
Shepard (1982): BPD + AC. The earliest widely adopted formula. Tends to overestimate at higher weights.
INTERGROWTH (2017): HC + AC. Developed by the INTERGROWTH-21st project. Does not use femur length.
The tool runs entirely in your browser, and stores nothing. No data is transmitted, no login required, no tracking. Just evidence-based math and the transparency to see how different methodological choices produce different clinical conclusions.
If you find this useful, share it with your provider. Or your patients. The numbers shouldn’t be a secret.
Many studies have compared these various tables and charts to the actual birthweight and found that Hadlock is generally closer although it increases the number of SGA compared to other tables. Most practitioners prefer to not miss an iugr and so err on the side of overcalling it. With that said how you intervene is another issue and nuance and understanding of fetal growth is key.
We have to use a chart consistently with the understanding that it’s imperfect